The Government has started a very cautious easing of the lockdown and some pubs or restaurants could open in July – but how critical is the rate of transmission, or the ‘R’ value. Tony McDonough reports

In the last few weeks, many of us have become familiar with the ‘R’ value, which estimates the current rate of coronavirus transmission. Politicians and Government scientists regularly refer to it in the daily briefings.
Accurate monitoring of this figure will be critical to how quickly we can try to get the economy moving again. It is particularly important for scenarios where a number of people are in the same confined space, such as bars, cafes and restaurants.
Hospitality is one of the business sectors hardest hit by the lockdown. The Government says it may allow some pubs or restaurants to start opening in early July if the evidence shows the spread of the virus remains under control. Hence the focus on the R value.
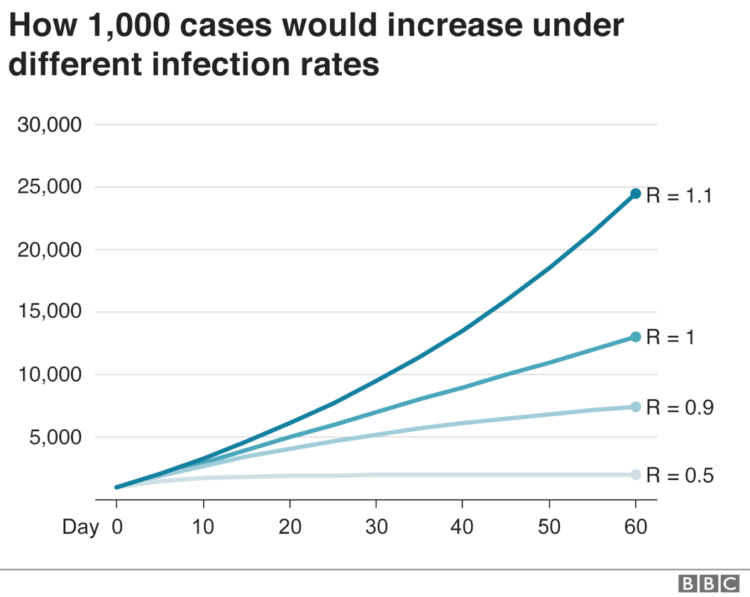
COVID-19 is estimated to have a R of 3 if it isn’t suppressed. It means every infected person will, on average, pass on the infection to three other people. Once R is below 1, the infection starts to decline. Although it is quite infectious, it is a long way behind measles which has a R of 15.
In Germany, it is believed the number has nudged back above 1 and there is concern that cases may rise again with the country coming out of lockdown. The UK Government will be watching closely to see what happens there.
The R value in the UK was estimated to be around 0.7 a couple of weeks ago, but is now thought to be somewhere between 0.75 and 1. But, like so many aspects of this epidemic, it is more complex than we may imagine. Precisely calculating where the R number is at any given moment in time is fiendishly difficult and, at best, will be an approximation.
Professor Adam Kucharski, a mathematician/epidemiologist at the London School of Hygiene and Tropical Medicine and author of ‘The Rules of Contagion’ warns against focusing too much on the R value because, while we can estimate an overall figure, it may vary widely in different locations and settings.
He explained: “Most real-time estimation of R involves looking at the ratio of change from one generation of infection to the next (which takes about five days on average). In reality, however, we rarely see the moment of infection, we just see cases appearing later.

“So the first task is to work out which data to use. Should we estimate R from cases, or hospitalisations, or deaths? The answer, of course, is we should look at all these data sources, noting that each has different delays we need to account for.
“Because most of these delays occur over a period of several days, and people are infectious for several days, it generates statistical uncertainty that makes precise daily estimates of R very difficult. If cases are under-reported, it doesn’t affect R estimation as long as under-reporting is consistent. However, detection is now improving in many countries, so we need to be extra-cautious about interpreting.”
Professor Kucharski adds that it is also important to look at transmissions in specific settings. So while community transmission is currently low in the UK, and in other European countries, it is higher in healthcare settings and care homes. There is also the impact of so-called ‘super-spreader’ events such as weddings and other gatherings.
“R is also an average value, so it doesn’t make sense to focus on R when case counts get very low, because transmission is driven by super-spreading events, which become disproportionately important when infection numbers are small,” he added.
“In summary, we generally have to estimate R from multiple datasets, each with its own notable uncertainties. So don’t expect a highly precise estimate of R, or one that will change in an easily measurable way from day-to-day.”

